> For the complete documentation index, see [llms.txt](https://docs.parallels.com/landing/llms.txt). Markdown versions of documentation pages are available by appending `.md` to page URLs; this page is available as [Markdown](https://docs.parallels.com/landing/ras-mp-guide/monitoring/configure-ras-performance-monitor-security.md).
# Configure RAS Performance Monitor Security
By default, any user can access the Performance Monitor page and view performance metrics. To increase security, you can set up the RAS Performance Monitor to use credentials so that only authorized users can view it.
First, remove anonymous authentication from the Grafana configuration file as follows:
1. Open file C:\Program Files\Parallels\RAS Performance Monitor\conf\defaults.ini.
2. In the file, look for the following:
`#################################### Anonymous Auth ######################`
`[auth.anonymous]`
`# enable anonymous access`
`enabled = true`
3. Change `"enabled = true"` to `"enabled = false"`.
4. **Note:** The user will be prompted to change the admin password automatically after disabling the anonymous access. After that, the password can be changed following the Grafana official documentation: .
5. Restart the Grafana service.
6. Select the **Monitoring** category and log in to Grafana using the following credentials:
* **User:** admin
* **Password:** admin (if you changed the password before, use the current password).
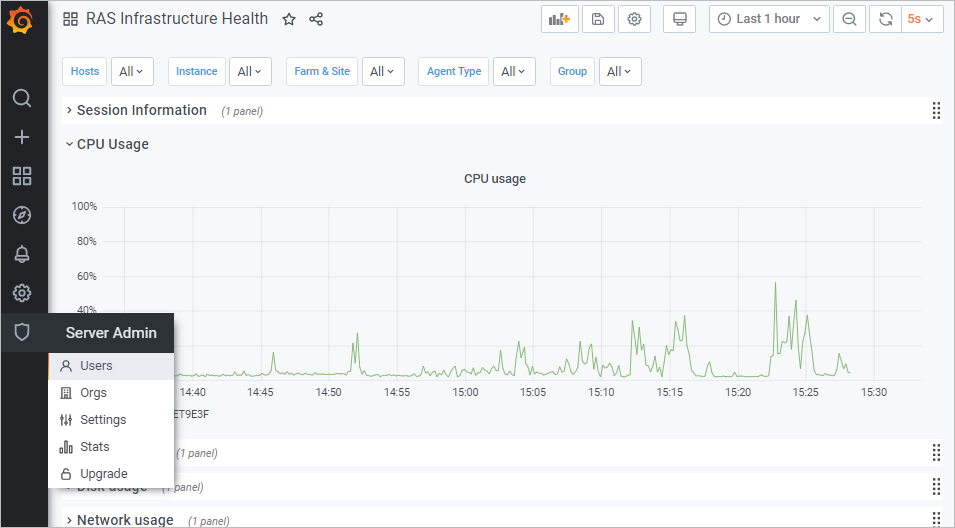
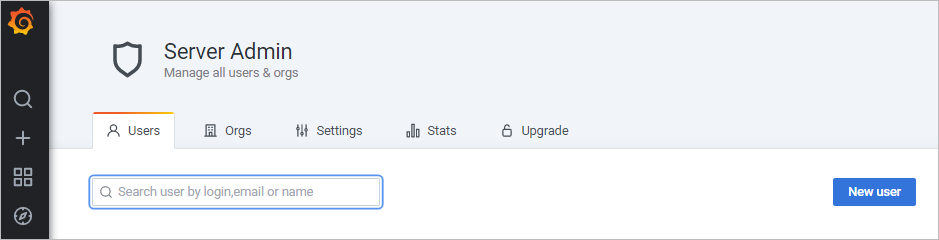
7. Once logged in, press "Esc" and then click the "shield" icon > **Users**.
8. Click **New user** and create a new user.
9. You now need to add the user to your organization's list. To do so, in the **Users** list, click **Edit** to edit the user and then set the organization and make the user a **Viewer**.
10. Click **Add** to add the user to your organization's list. The user can now view the RAS Performance Monitor statistics.
---
# Agent Instructions
This documentation is published with GitBook. GitBook is the documentation platform designed so that both humans and AI agents can read, navigate, and reason over technical content effectively. Learn more at gitbook.com.
## Querying This Documentation
If you need additional information that is not directly available in this page, you can query the documentation dynamically by asking a question.
Perform an HTTP GET request on the current page URL with the `ask` query parameter, and the optional `goal` query parameter:
```
GET https://docs.parallels.com/landing/ras-mp-guide/monitoring/configure-ras-performance-monitor-security.md?ask=&goal=
```
`ask` is the immediate question: it should be specific, self-contained, and written in natural language.
`goal` is optional and describes the broader end goal you are ultimately trying to accomplish on behalf of the user. GitBook uses it to tailor the answer towards what is most useful for that goal.
The response will contain a direct answer to the question and relevant excerpts and sources from the documentation.
Use this mechanism when the answer is not explicitly present in the current page, you need clarification or additional context, or you want to retrieve related documentation sections.