Loading...
Loading...
Loading...
Loading...
Loading...
Newer versions of Grafana may be incompatible with a browser installed in the OS. A modern Edge browser is supported and will be embedded automatically in the RAS Console. But if it's not so, we suggest using a redistributable browser that comes in a form of a plugin. Plugins are available as separate msi packaged and distributed the same way as all other Parallels RAS distributions.
To avoid potential issues, Parallels RAS monitors which versions of Grafana and browser are installed and informs the RAS administrator about it when necessary. In a situation like that, when you select the Monitoring category, you will not see a dashboard as usual. Instead, a message is displayed that an updated browser plugin must be installed. To install the plugin, follow the instructions below.
In the main menu (at the top), click Tools and choose Plugins.
In the Plugins dialog, locate the Browser Engine plugin. The State column should indicate that it is not installed.
Select the plugin and click one of the following buttons:
Install online — Downloads the plugin from the Internet and installs it. Click this button if you can access the Internet from your environment.
Install offline — In an offline environment, admin can't get the list of plugins and instead uploads the plugin zip from a local file server. Only installed plugins are listed in the plugins table.
After the plugin is installed, you can go back to the Monitoring category and this time you will see the Grafana dashboard.
To update or remove a plugin (if necessary), use the same instructions as above, but select a plugin that is marked "installed" and then click Update online (or offline) or Uninstall. Please note that custom dashboards are now maintained after upgrades from Parallels RAS 18 to future versions.
To enable data collection and view the dashboard:
In the RAS Console, navigate to Administration > Reporting.
Select the Enable RAS Performance Monitor option (the RAS Performance Monitor configuration section).
Enter the FQDN or IP address of the server where you have the InfluxDB database and Grafana dashboard installed.
Click Apply to commit the changes.
Once you perform the steps above, the Telegraf service is started on each server in the Site and the data collection begins.
Note: You should give Parallels RAS Performance Monitor some time to collect performance data before you can view it (about 1 hour on initial installation).
To view performance metrics, select the Monitoring category in the RAS Console. The data is displayed in the right pane. The logon is performed automatically, so no logon credentials are required.
The buttons on the Monitoring tab (below the dashboard area) are as follows:
Home. Displays the home page. The button is useful when you click on an external link in the dashboard, which may take you to an external web page.
Refresh. Reloads the current page.
Open in browser. Opens the performance dashboard in a web browser.
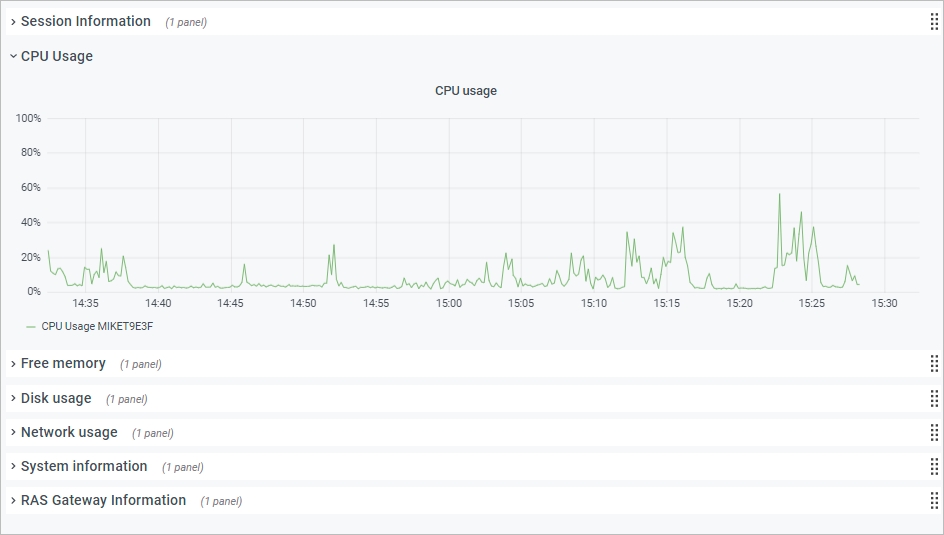
To view metrics of a specific type, expand the desired category in the main area of the dashboard. The categories include:
Session Information. Displays the information about active sessions and disconnected sessions.
CPU usage. CPU counters.
Free memory. Physical memory counters.
Disk usage. Disk I/O counters.
Network usage. Network interface I/O counters.
System information. System information counters.
RAS Gateway information. RAS Gateway counters.
Performance metrics are displayed in the dashboard as a graph. Different counters are displayed using different colors.
To zoom in on a particular area of a graph, select a rectangular block with a mouse. You can also use the Zoom controls at the top of the dashboard for time range zoom out, shift time forward, or shift time backwards. To select a specific time range, click the "clock" icon at the top and then specify a time range.
By default, the dashboard opens in kiosk mode. To exist it, press "Esc". To cycle view mode, click the "monitor" icon in the upper right. When you exist kiosk mode, the RAS Infrastructure Health page is displayed:
The menu at the top has the following items:
Hosts. Allows you to select one or multiple servers for which the performance metrics should be displayed. To display the data for all servers in the Site, select All. Please note that if you don't see any servers in the list, you need to wait for Parallels RAS Performance Monitor to collect the initial set of statistics. This only happens on initial installation.
Instance. This item allows you to select a specific counter instance (if there's more than one). For Network counters it is usually the name of a network interface. For Disk counters it is a disk name. Other types of counters don't usually have multiple instances.
Farm & Site. Select a Site for which to display the data. Selecting All displays the data for all sites in the Farm. If you have another RAS Farm, and the RAS Performance Monitor is configured and enabled in it, you can also select a Site from that Farm.
Agent Type. Select a RAS agent type.
Group. Select an RDS group.
For more information about performance metrics and their meaning, please refer to the following articles from Microsoft:
See also RAS Performance Counters.
Parallels RAS Performance Monitor is a separate component of Parallels RAS with its own installer. It can be installed on a dedicated server or on a server hosting any of the Parallels RAS components. When you run the installer, the InfluxDB database and the Grafana dashboard service are automatically installed. For additional info, see the Installation subsection below.
The following firewall rules (open ports) are automatically added on the server where you install Parallels RAS Performance Monitor:
TCP port 8086 (used by the InfluxDB database).
TCP port 3000 (used by the Grafana performance dashboard).
To install Parallels RAS Performance Monitor:
Download the Parallels RAS Performance Monitor installer from https://www.parallels.com/products/ras/download/links/.
Run the installation wizard (the RASPerformanceMonitor.msi file) and follow the onscreen instructions.
Close the wizard when finished.
Parallels RAS Performance Monitor is a browser-based dashboard designed to help administrators analyze Parallels RAS deployment bottlenecks and resource usage. The dashboard provides a visual display of performance metrics, which can be viewed in the Parallels RAS Console or in a web browser.
Parallels RAS Performance Monitor consists of the following components:
InfluxDB database — a database for storage of system performance data.
Grafana dashboard — a browser-based dashboard providing a visual display of performance metrics.
Telegraf service — a service that collects performance data on a server where it is installed. The service is installed automatically when you add a server to a Parallels RAS Farm and install a corresponding RAS Agent on it (e.g. RAS Secure Gateway Agent, RD Session Host Agent, Remote PC Agent, etc.).
The Telegraf service is stopped by default, so it doesn't collect any data. To start the service on each server in the Farm, the performance monitoring functionality must be configured and enabled in the Parallels RAS Console. Once enabled, the Telegraf service begins collecting a predefined set of performance counters at a fixed time interval (10 seconds). It then sends the collected data to the InfluxDB database for storage. To view performance metrics, the Parallels RAS administrator uses the dashboard (Grafana), which displays the visual representation of performance counters in real time.
The performance metrics are grouped in the dashboard by type (Session, CPU, Memory, Disk, etc.), so the administrator can view each group of metrics separately. The administrator can also select whether to view performance metrics for one or more specific servers or for all servers in the Farm or Site. In addition, the administrator can select a specific Site for which the data should be displayed.
By default, any user can access the Performance Monitor page and view performance metrics. To increase security, you can set up the RAS Performance Monitor to use credentials so that only authorized users can view it.
First, remove anonymous authentication from the Grafana configuration file as follows:
Open file C:\Program Files\Parallels\RAS Performance Monitor\conf\defaults.ini.
In the file, look for the following:
#################################### Anonymous Auth ######################
[auth.anonymous]
# enable anonymous access
enabled = true
Change "enabled = true" to "enabled = false".Note: The user will be prompted to change the admin password automatically after disabling the anonymous access. After that, the password can be changed following the Grafana official documentation: https://grafana.com/docs/grafana/latest/manage-users/user-admin/change-your-password/.
Restart the Grafana service.
Select the Monitoring category and log in to Grafana using the following credentials:
User: admin
Password: admin (if you changed the password before, use the current password).
Once logged in, press "Esc" and then click the "shield" icon > Users.
Click New user and create a new user.
You now need to add the user to your organization's list. To do so, in the Users list, click Edit to edit the user and then set the organization and make the user a Viewer.
Click Add to add the user to your organization's list. The user can now view the RAS Performance Monitor statistics.


